Backspace: New York Times Bestseller List Web Scraping
Using an old(ish) R script to acquire new NYT data
This post is part of a new series I’m trying called Backspace, in which I revisit some of my old code, perhaps revise some code, and see what new insights I can glean from it. Hope you enjoy!
Two years ago, I was making my first forays into R and, as my final project for a half-semester class, had to write a web-scraping script in R. Or maybe I just had to do data cleanup - but scraping our own data was advantageous, since the 5 most impressive scripts earned a 100 while everyone else was limited to a 95. I’m a big fan of novels, especially middle grade and YA fiction, so I decided to scrape the New York Times best seller list and see which books stayed on the list the longest.
That was when I found out that the New York Times has multiple best seller lists. So I decided to consider a slightly different question: do children’s books have more list longevity than adult fiction books, or are they more fleeting?
Today I revisit this question using more modern data (read: data I scraped this morning for this post). You can find my code at this GitHub repo; it contains both the file I submitted for my final project and the updated version I use for this analysis.
The Data
The data covers 53 weeks of New York Times best seller lists: one for Children’s Middle Grade Hardcover and one for Combined Print & E-Book Fiction. This isn’t a perfect comparison of these two demographics; these lists bear several structural differences: -First, as the names imply, the middle grade list only includes hardcover books; as far as I can tell, the non-middle-grade list features ebooks as well as hardcover and paperback. -As you might have figured, the non-middle-grade list is only fiction; the middle grade list also contains nonfiction books. -Finally, one fact you couldn’t figure out just from looking at the names: the middle grade list only features ten books per week, while the non-middle-grade list features fifteen a week.
The final, combined list yields 174 distinct books from the Print/Ebook Fiction list and only 58 from the Middle Grade list; this is disproportionate compared to the expected 15/10 per week split, so we should expect middle grade books to place higher on the list than most adult fiction books. The means of each data set support this, with the middle grade list having an average of 9.1 weeks per book compared with the adult fiction list having an average of 4.6 (the overall list averages 5.7 weeks).
The Findings
I started this analysis with a plot in R using ggplot. It gives a decent picture of books and how many weeks they spent, but it does lack some color. (The x axis is simply a ranking or index of each individual book by number of weeks.)

I’ve been wanting to get some experience using Tableau, so I used it to generate a few more summary plots - mostly EDA in comparison to the R plot, but I thought it was a fun experiment and a good exercise.

This shows all authors with three or more works on one or both of the lists during this time frame. I didn’t look up release dates for these books, but Colleen Hoover is extremely prolific any way you slice it. Alan Gratz is the only individual on the middle grade list with more than three works, which is a little surprising - but this can be attributed both to the general lower variation in middle grade best sellers and to only having ten spots as opposed to fifteen.
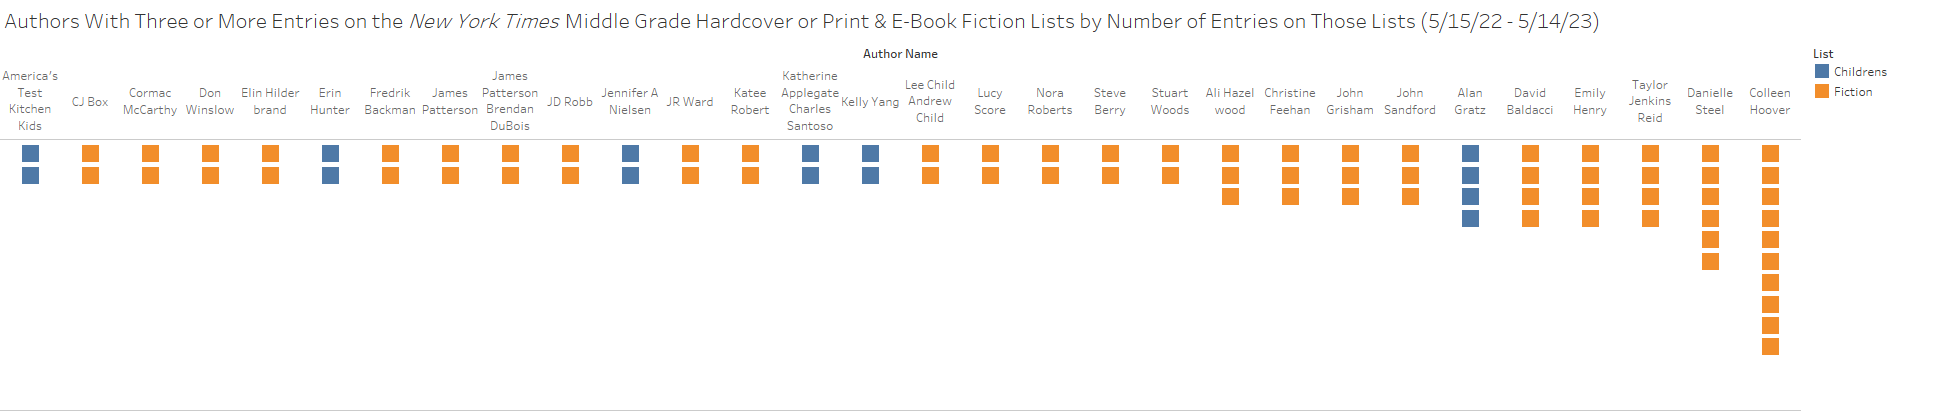
Here’s a similar list but with anyone with more than one work on one or both lists during this time. It’s interesting (but maybe not surprising) that no author or author group has works on both lists.
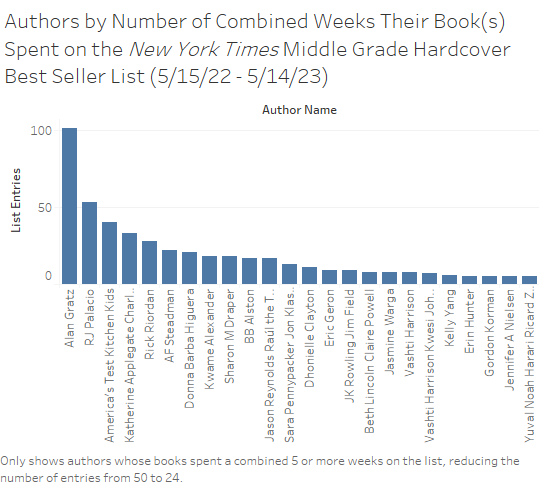
This plot shows the number of weeks authors (or author groups) spent on the Middle Grade Hardcover list. Obviously, the only way to have more than 53 weeks is by having multiple works on the list, as Alan Gratz does to have 104 weeks. It should be noted that RJ Palacio’s single work Wonder has been on the charts all 53 weeks observed. I also don’t know how I feel about “America’s Test Kitchen Kids” being an author, or about two cookbooks being “middle grade” hardcovers, but I digress.
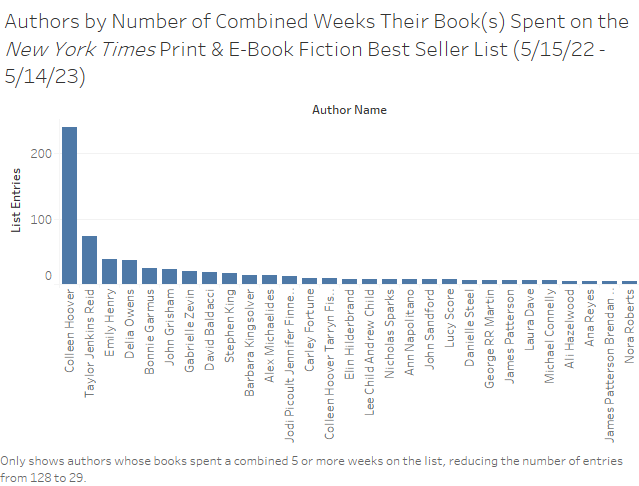
Once again, multiple works let Colleen Hoover (and Taylor Jenkins Reed) take the top spots. It’s so hard to read this graph, I made another one without Colleen Hoover.

It strikes me as odd that Danielle Steel only has six weeks with six works - perhaps Steel’s fans buy each work as it releases, with no residual sales? Delia Owens’s Where the Crawdads Sing had its film adaptation released during this time frame, which likely contributed to it attaining 36 weeks on the list.
There are just a couple of insights! You can find my code and Tableau workbook in the GitHub repo at the beginning of this article. Let me know below if you find any other insights or want more analysis on this data!